Amnesty International Italy –
Il barometro dell’odio
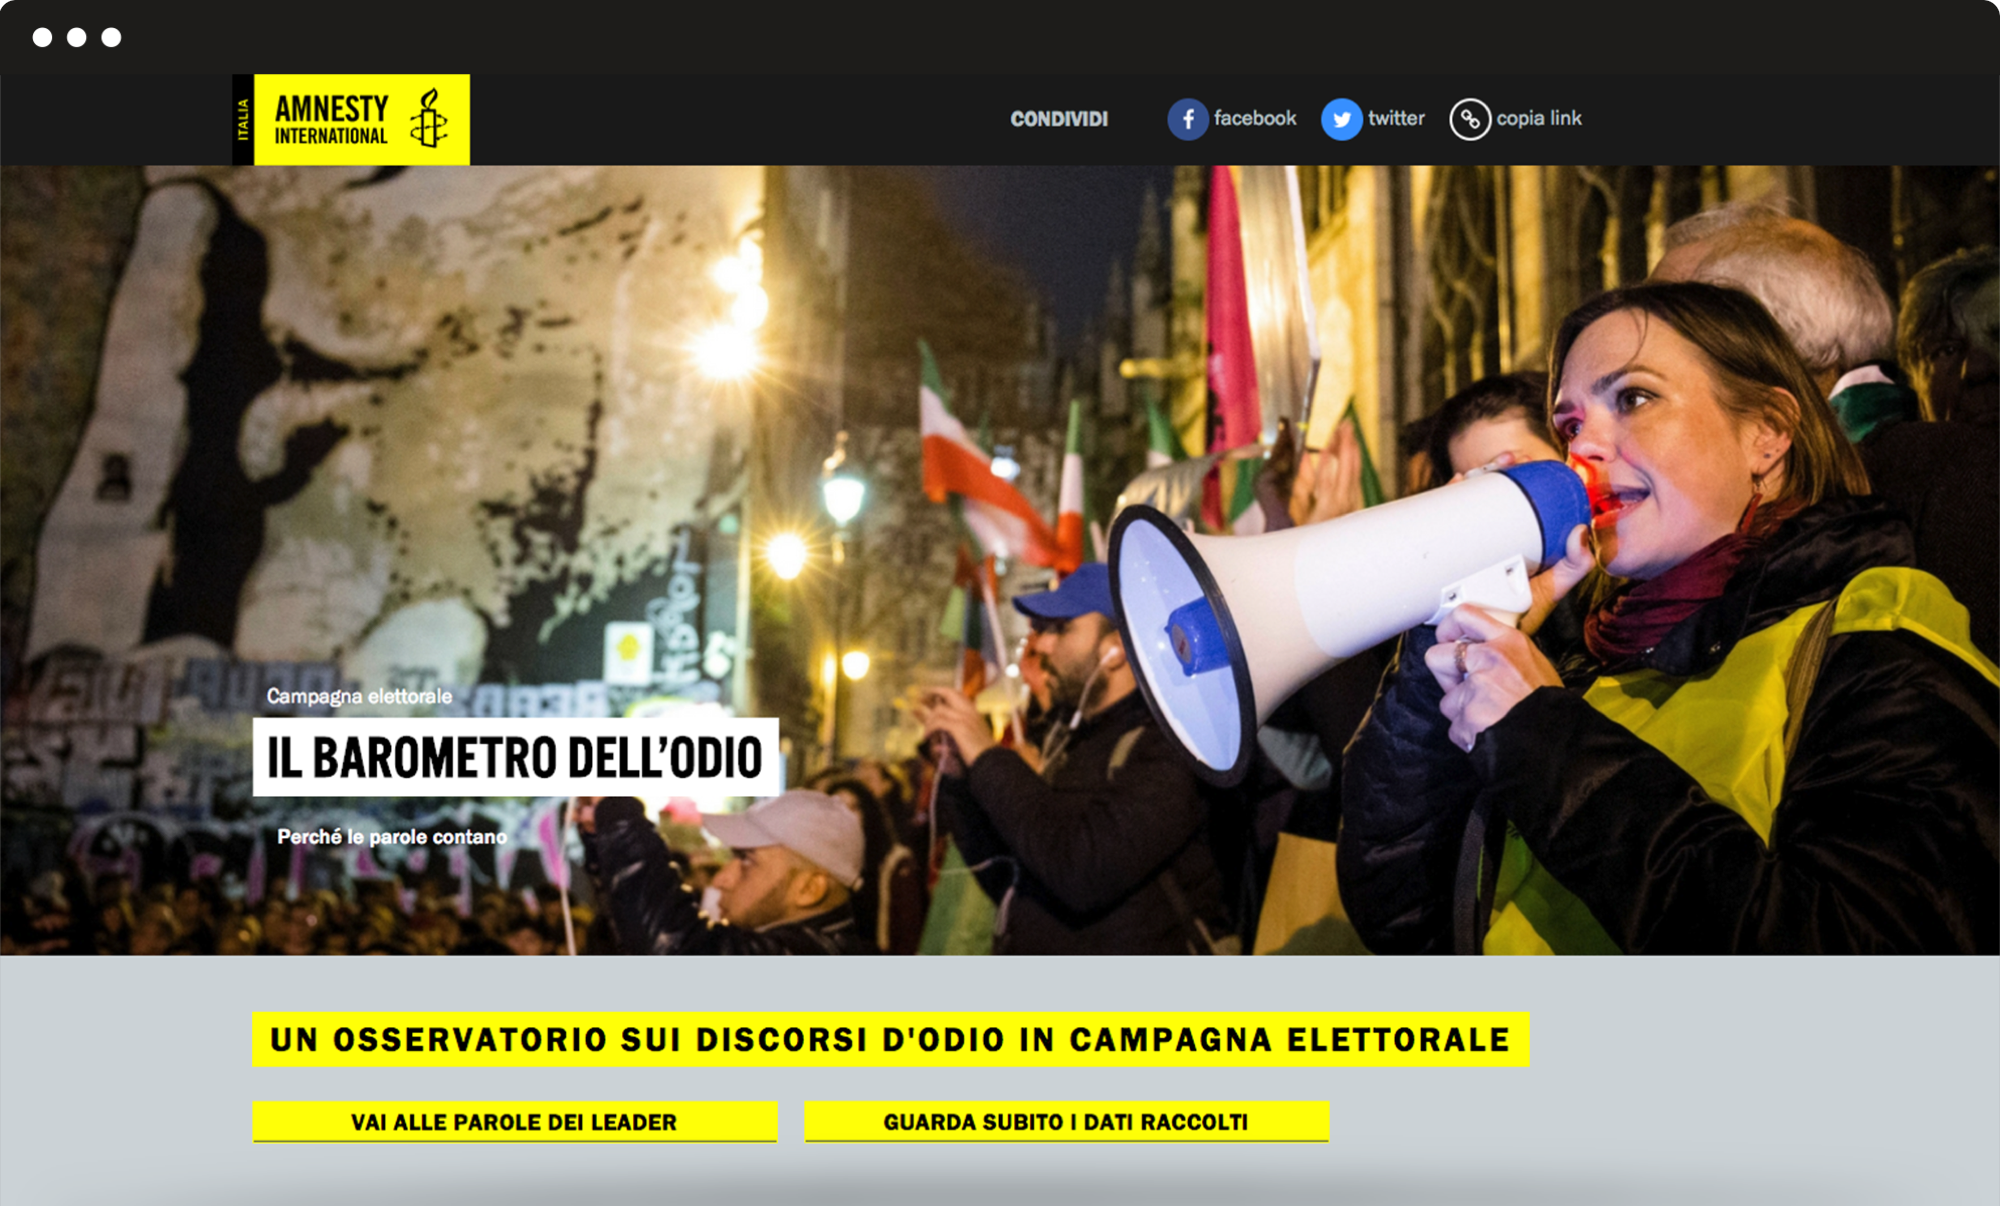
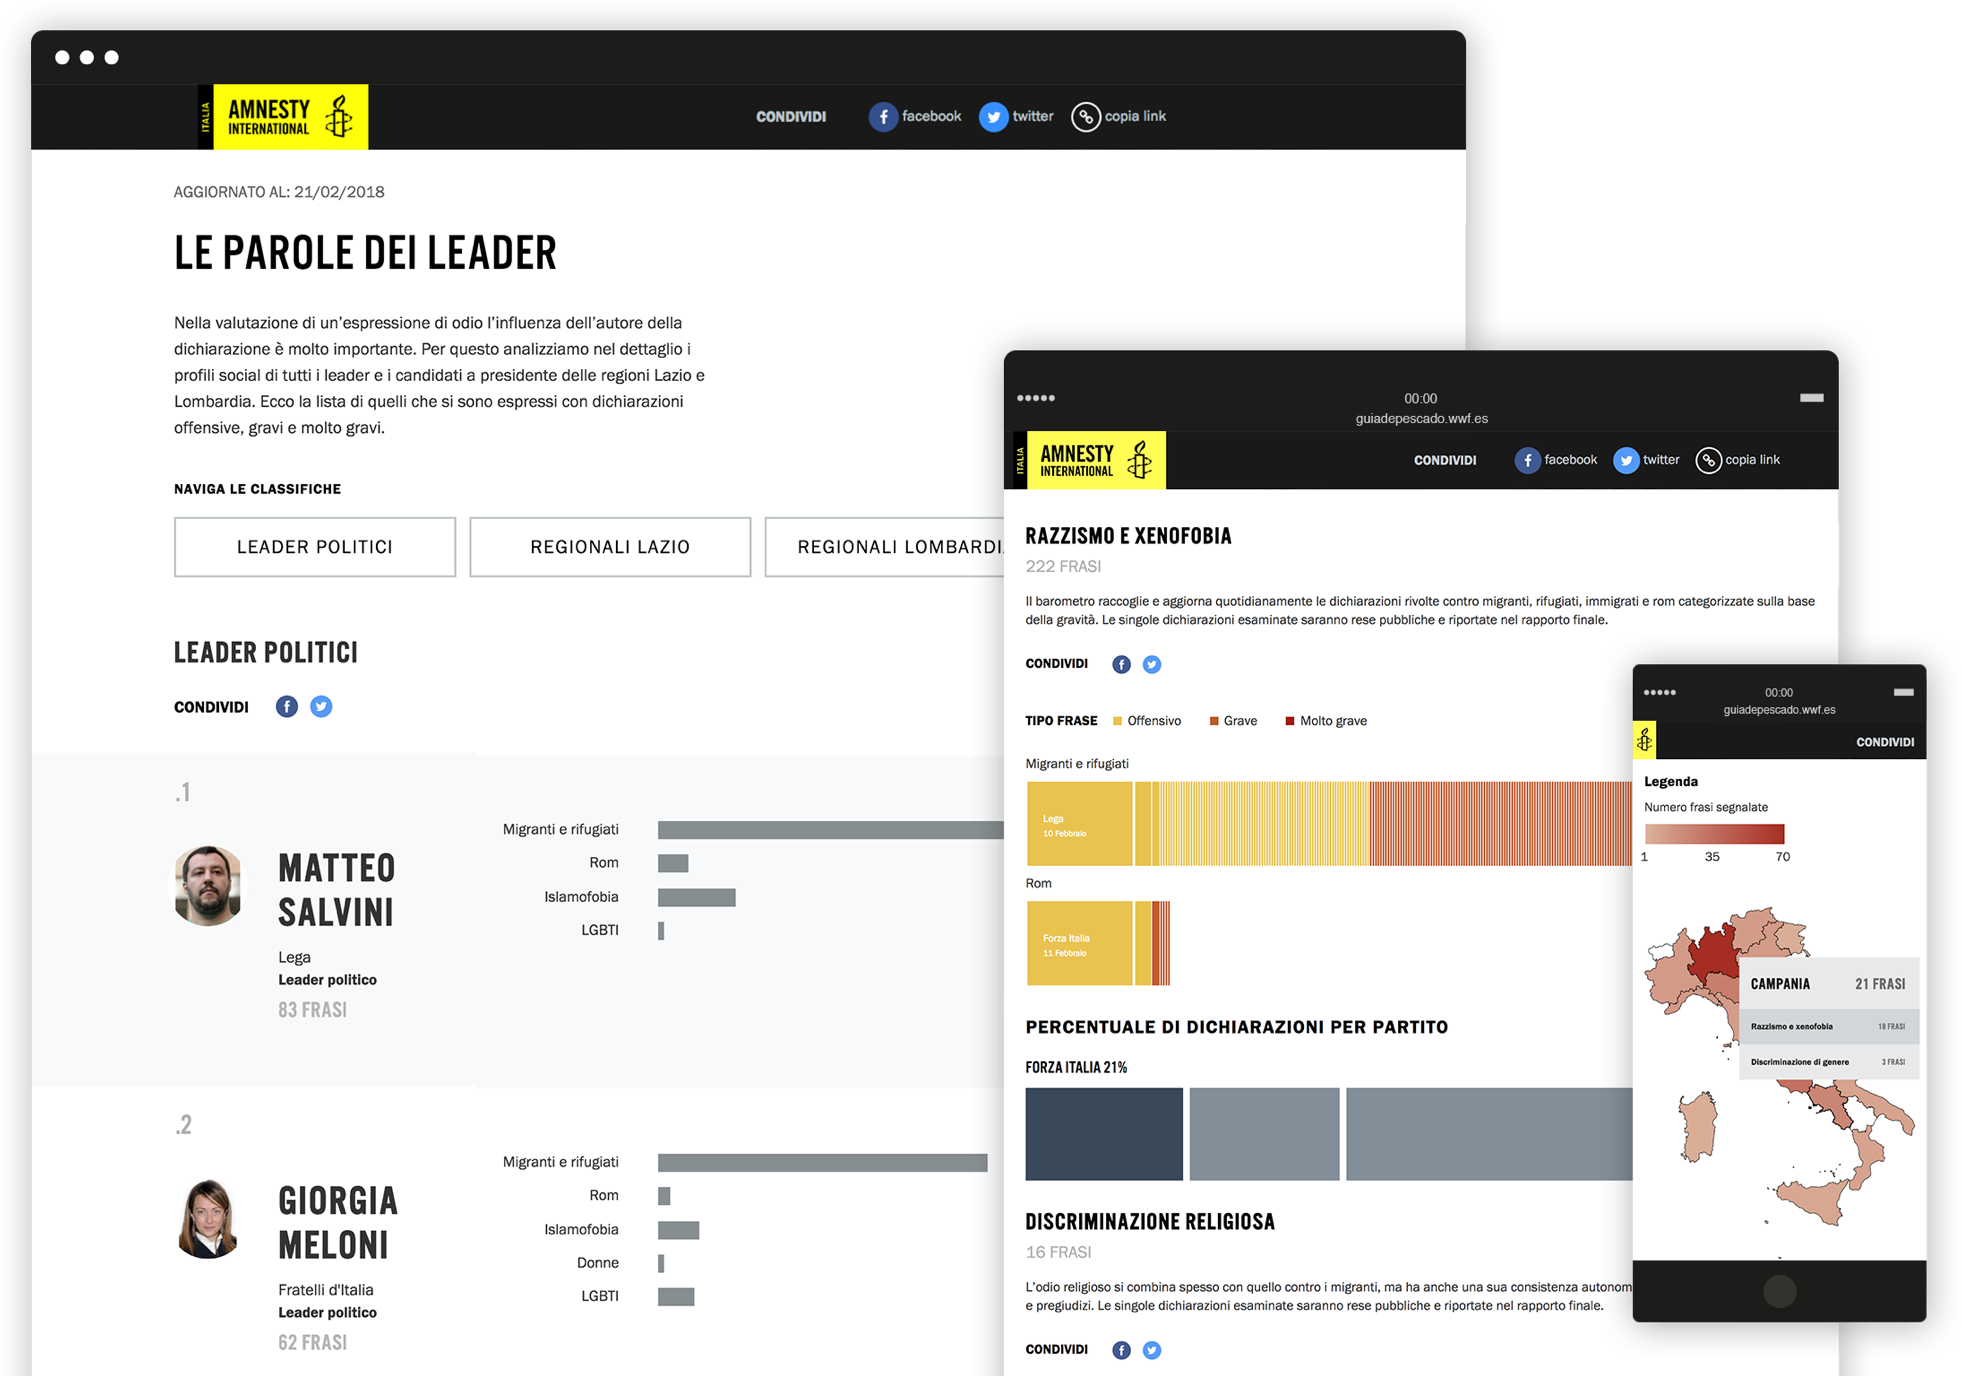
We built a microsite to track and display data about the hate speech of candidates during the 2018 Italian political elections campaign. The different data were uploaded every day and displayed in accessible dynamic graphics, to provide users with an engaging tool and a smooth navigation experience.

Data visualization
An intuitive backend to allows uploading the data every day during the campaign.
We had to transform the methodology to track and evaluate hate speech sentences said by hundreds of candidates, into dynamic charts and graphics. This allows to show all the different data at once: the topic of each sentence, how bad it is, who said it and where/when, which political party is doing worst, which candidate has said the highest number of sentences and much more. We developed a stable frontend to visualize such data smoothly and encourage the user’s interaction with the charts.
